City economic insights
A snapshot that explores emerging economic and business trends and seeks to understand their longer-term impacts on the city.
Published
These periodic studies show how people use, visit and spend in the city.
Takeaways
- Tuesday was the busiest day for visits to the city in September, continuing the shift in peak activity from Thursday to earlier in the week (also seen in June and August).
- Growth in consumer spend was strong in September. Weekly average consumer spend was $264m, up 7.2% from September 2024. Saturdays were the highest spending day ($46m on average) and Sundays the lowest ($31m on average).
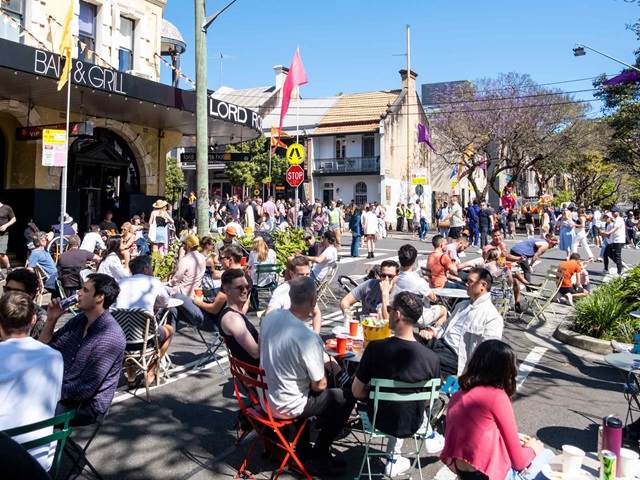
- Spend on all high streets, except King Street, was significantly higher in the financial year 2024/25 than pre-pandemic levels. Stanley Street showed the strongest growth with spend up 48%, followed by Haymarket, up 43.5% (all in nominal terms).
- High street spend is driven by visitors. Regional visitors are the fastest growing spend segment. Spend by visitors from regional NSW and interstate regions is up 8.0% and 9.5% respectively, year-on-year.
City insights – October 2025PDF · 729.35 KB · Last modified